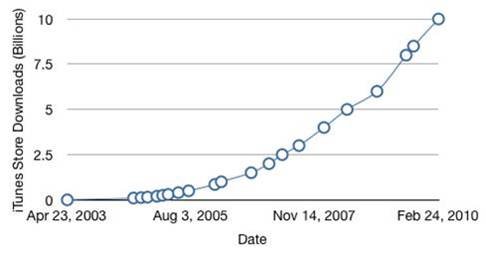
This graph's data appears to follow a exponential growth function. This is the original graph.
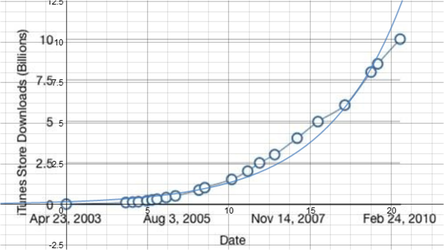
This is the original graph and a exponential growth function that closely relates to the data. The formula for this function is 1.3 ^(0.8x - 6.9).
The domain for the function that I applied is all real numbers or (-∞,∞). Since the x values are dates it makes sense to limit the domain to 0 or the starting point April 23, 2003.
The range for this function is (0,∞). The reason why y can't be a negative number is because y represents the number of iTunes store downloads. It doesn't make sense for there to be negative downloads.
After reading this article it presents new data that could effect the way the graph is interpreted. The data that is presented shows a decrease of downloads in the year 2013, which effects the idea of this graph being an exponential growth function. The domain and range would stay the same because the reasoning is the same with or without the old data.
 RSS Feed