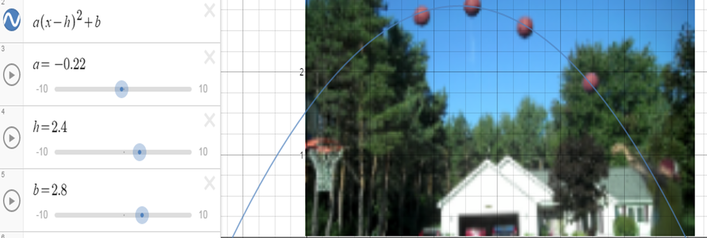
From the line of best fit, that I created for this picture, it shows that the ball will overshoot the hoop and not go in.
|
From the line of best fit, that I created for this picture, it shows that the ball will overshoot the hoop and not go in.
0 Comments
A. All of my prediction graphs were similarly shaped to the actual values graphs. The 21 inch ramp's actual values graph had a gentler slope while rising and falling than my predication graph had. The maximum distance that the skateboard reached was almost the same for both graphs. The 14 inch ramp's actual values graph closely matches except for the rising slope which was gentler than my prediction. My prediction for the 7 inch ramp was the farthest away from being accurate if you compared the three graphs. In my prediction the slope is steeper at the rise and then gentler than the actual values graph towards the last half of the graph. B. The zeros on my graph represents the original starting point. C. All of the graphs have the same zero, which is the point (0,0). This is the starting point where the skateboard hasn't moved and time hasn't passed yet. As you lower the ramps the maximum feet traveled decreases. An example, being that the 21 inch ramp had a maximum of 62 feet, and the 7 inch ramp had a maximum of 42 feet. The skateboard from the 21 inch and 14 inch ramps reached a maximum and then began traveling back towards the starting point while the skateboard from the 7 inch ramp stopped moving after it reached its maximum. D. When the graphs are rising the fastest is when the skateboard is being let down the ramps. This means that the ramps help speed up the skateboards. The graph decreases the fastest when the initial speed from the ramps wears off and the skateboard starts moving down the pavement towards the starting point. This means that the skateboard is gradually traveling slower and slower. 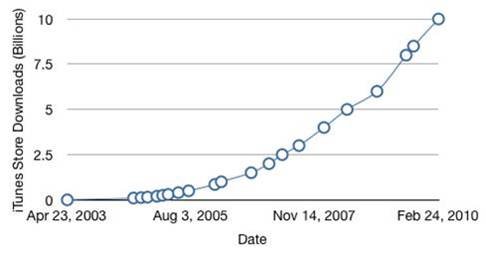 This graph's data appears to follow a exponential growth function. This is the original graph. 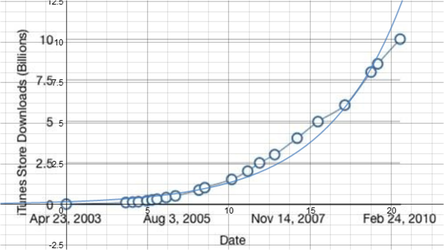 This is the original graph and a exponential growth function that closely relates to the data. The formula for this function is 1.3 ^(0.8x - 6.9). The domain for the function that I applied is all real numbers or (-∞,∞). Since the x values are dates it makes sense to limit the domain to 0 or the starting point April 23, 2003. The range for this function is (0,∞). The reason why y can't be a negative number is because y represents the number of iTunes store downloads. It doesn't make sense for there to be negative downloads. After reading this article it presents new data that could effect the way the graph is interpreted. The data that is presented shows a decrease of downloads in the year 2013, which effects the idea of this graph being an exponential growth function. The domain and range would stay the same because the reasoning is the same with or without the old data.
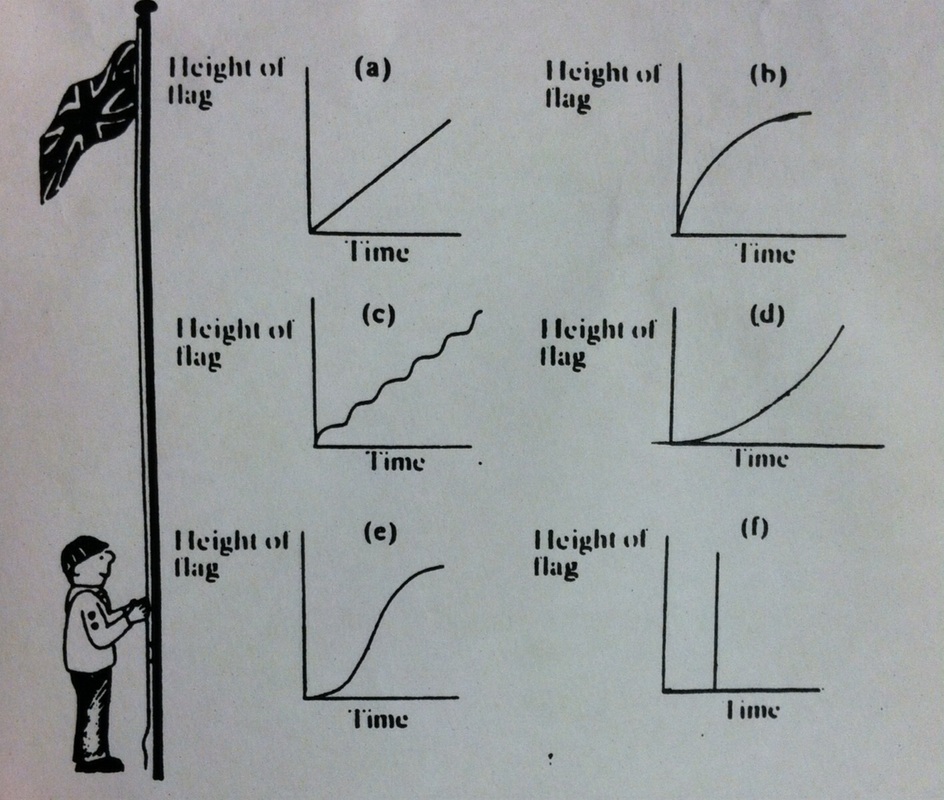 1) Graph A means that the flag is being raised at a constant speed.
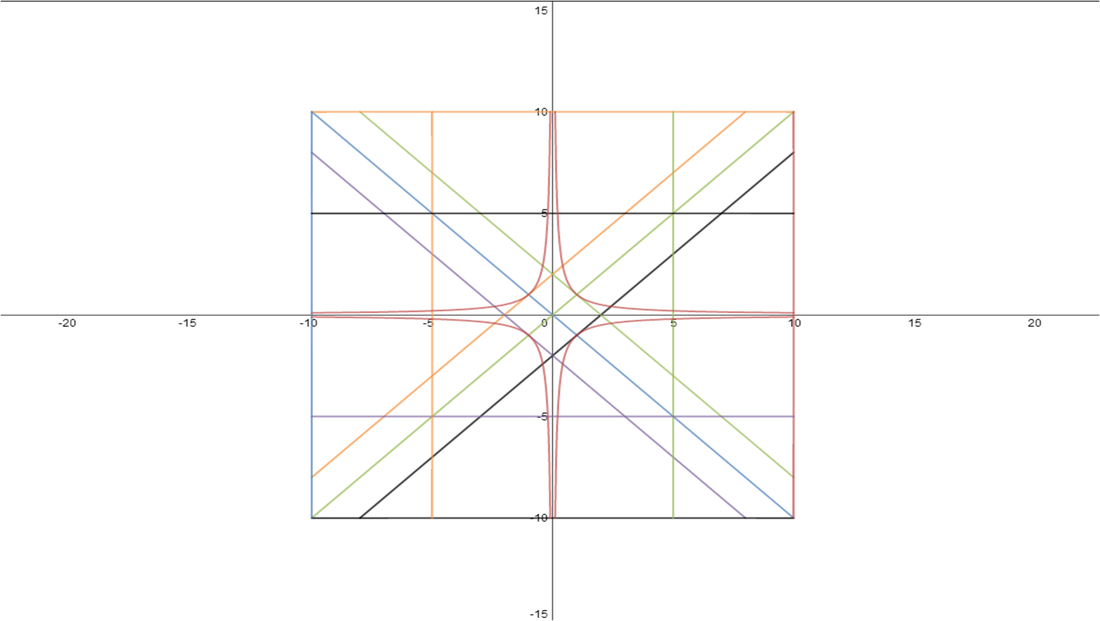
Graph B means that the flag is being raised at a slower pace as time goes on. Graph C means that the flag is being raised at intervals of slow and fast paces as time goes on. Graph D means that the flag is being raised at a faster pace as time goes on. Graph E means that the flag is being raised at a slower speed, speeding up then returning to a slower pace. Graph F means that the flag is raised all the way in a very short amount of time 2) Graph C would be the most realistic scenario because you hoist a flag by pulling down on a rope, so each time you pull down represents the sharp spikes in height. You need time to put your next hand on the rope and pull so that represents the more gradual slopes of the graph 3) Graph F is the most unrealistic because it would mean that the flag was hoisted in one pull of the rope very quickly. My art consist's of a series of identity, reciprocal, and constant functions. The horizontal and vertical lines are constant functions.The diagonals are identity functions. Some of the identity functions are parallels to each other because they have the same slope. The functions that intersect perpendicularly have slopes that are opposite reciprocals of each other. That's why they intersect at a 90 degree angle. The curved lines that form a four-pointed star in the middle of the picture are two reciprocal functions. All of these functions have been restricted in length by using brackets.
| Lauren BindschatelThis is my math blog, therefore I blog math. ArchivesNovember 2014 Categories |
 RSS Feed