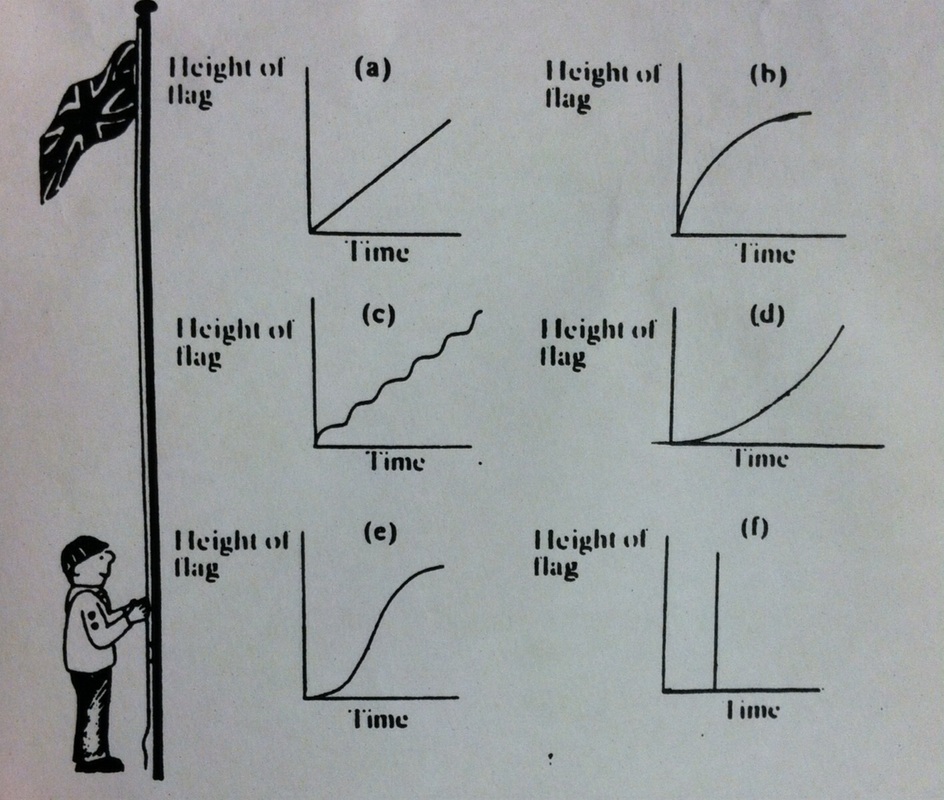
1) Graph A means that the flag is being raised at a constant speed.
Graph B means that the flag is being raised at a slower pace as time goes on.
Graph C means that the flag is being raised at intervals of slow and fast paces as time goes on.
Graph D means that the flag is being raised at a faster pace as time goes on.
Graph E means that the flag is being raised at a slower speed, speeding up then returning to a slower pace.
Graph F means that the flag is raised all the way in a very short amount of time
2) Graph C would be the most realistic scenario because you hoist a flag by pulling down on a rope, so each time you pull down represents the sharp spikes in height. You need time to put your next hand on the rope and pull so that represents the more gradual slopes of the graph
3) Graph F is the most unrealistic because it would mean that the flag was hoisted in one pull of the rope very quickly.
 RSS Feed